Trade Dashboard#
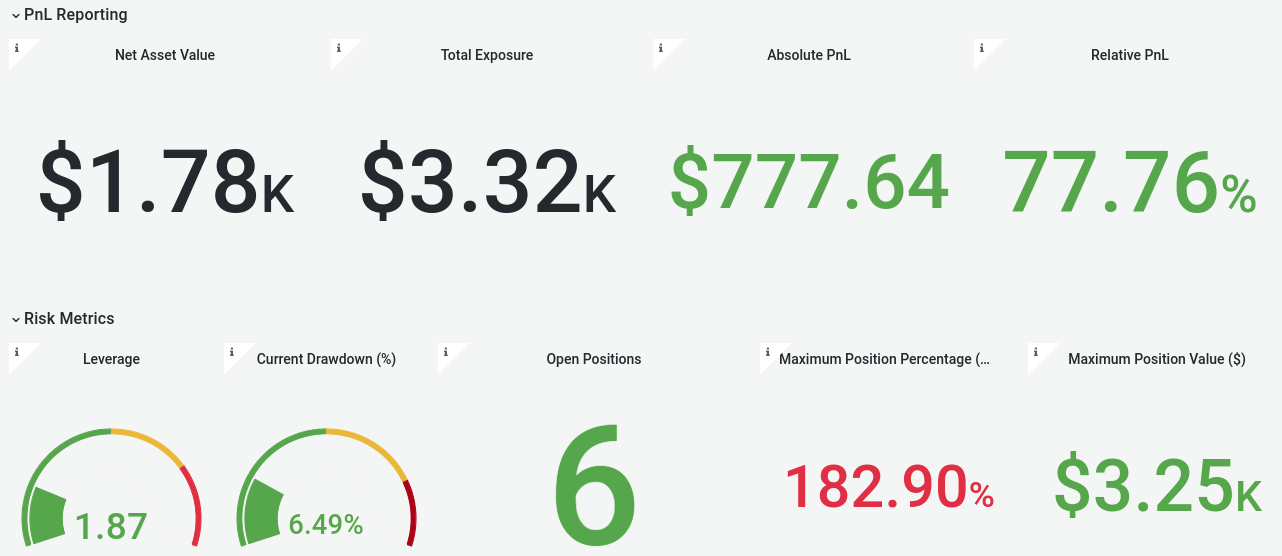
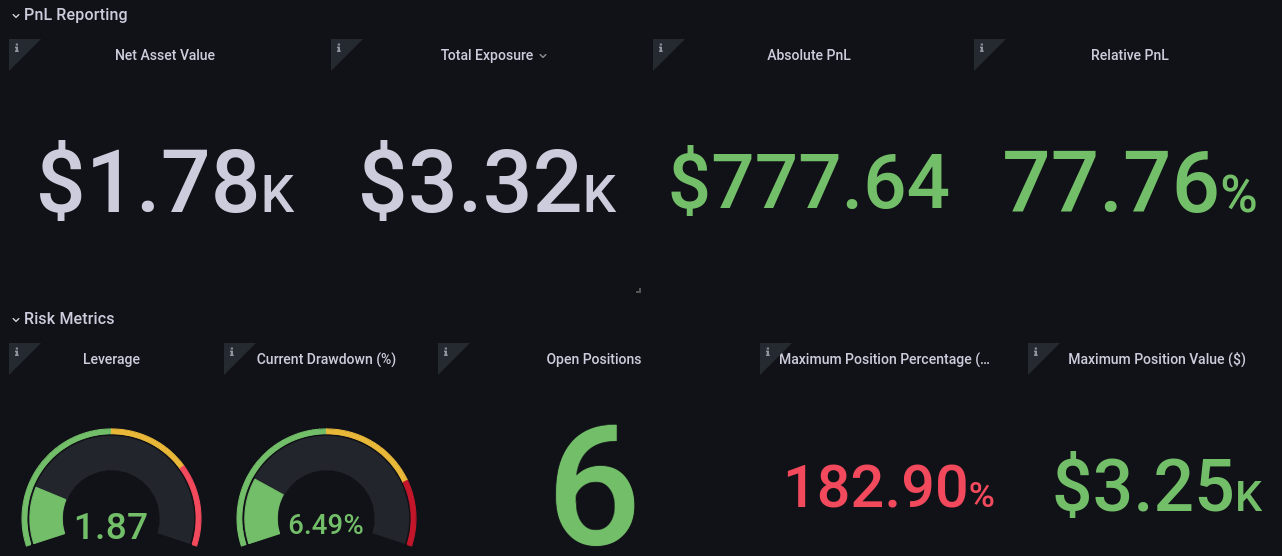
An effective way of monitoring your trading bots performance while live trading is to use a dashboard. This provides a high level overview of what is happening, allowing you to monitor that everything is going as it should.
AutoTrader makes this an easy task, and even offers a template dashboard
to use with Grafana. This template uses the Python
client of the data monitoring
software Prometheus. The template file can be
found in the templates directory of the
AutoTrader repository, and is previewed below.
Getting Started#
In order to set the dashboard up, you must first install Prometheus and Grafana.
Prometheus#
Follow the instructions
here to
install Prometheus. If you are on a Mac, you can run
brew install prometheus.
Next, configure prometheus by editing prometheus.yml. This file is
normally in the installation directory. If you installed via brew, it
will usually be in /opt/homebrew/etc/prometheus.yml. Add the following
to the scrape_configs. Set the port (eg. 8009 in the example below) to
one which you plan to use, or leave as is.
scrape_configs:
  - job_name: 'autotrader'
    static_configs:
      - targets: ['127.0.0.1:8009']
Once you have completed the above, install the Python client:
pip install prometheus-client
Grafana#
Follow the instructions here to install Grafana. You will also need to create an account.
Once complete, open Grafana and add a Prometheus data source:
Click the settings wheel
Select “Data Sources”
Select Prometheus
Set the URL to
http://localhost:9090/Save.
Finally, select “Import” under Dashboards. Click the “Upload JSON file”, and provide the dashboard template file. No data will be shown yet, until we have Prometheus and the Monitor running.
The Monitor#
AutoTrader serves trading metrics via Prometheus from the
Monitor class. This class can be instantiated
from a Python script, or via the
Command Line Interface. The following metrics will be exposed.
Metric |
Description |
|---|---|
|
The net asset value. |
|
The account drawdown. |
|
The notional value of the largest position. |
|
The fractional size of the largest position. |
|
The absolute PnL of the account. |
|
The relative PnL of the account. |
|
The number of positions held. |
|
The total exposure of the account. |
|
The net exposure of the account. |
|
The active leverage of the account. |
Configuration#
Add the following monitor configuration yaml file to your config
directory.
# monitor.yaml
port: 8009
broker: "ccxt:binanceusdm"
environment: "paper"  # paper or live
initial_nav: 1000  # Reference NAV for PnL calculations
max_nav: 1000  # Maximum NAV for drawdown calculations
sleep_time: 30  # Monitor update time (s)
# monitor.yaml
port: 8009
picklefile: "broker_picklefile"
environment: "paper"  # paper or live
initial_nav: 1000  # Reference NAV for PnL calculations
max_nav: 1000  # Maximum NAV for drawdown calculations
sleep_time: 30  # Monitor update time (s)
Start Prometheus#
Before launching the monitor, make sure that Prometheus is running.
For Linux machines, use ./prometheus to run the executable in install
directory. For Mac machines, run brew services start prometheus.
Launch Monitor from script#
The snippet below provides a sample for launching the monitor from a Python script file.
from autotrader.utilities import Monitor

monitor = Monitor(config_filepath="config/monitor.yaml")
monitor.run()
Launch Monitor from CLI#
Launching the monitor from the command line is as simple as specifying
the monitor config filepath to the monitor function:
autotrader monitor -c config/local_monitor.yaml
You will see an output similar to that shown below.
░█████╗░██╗░░░██╗████████╗░█████╗░████████╗██████╗░░█████╗░██████╗░███████╗██████╗░
██╔══██╗██║░░░██║╚══██╔══╝██╔══██╗╚══██╔══╝██╔══██╗██╔══██╗██╔══██╗██╔════╝██╔══██╗
███████║██║░░░██║░░░██║░░░██║░░██║░░░██║░░░██████╔╝███████║██║░░██║█████╗░░██████╔╝
██╔══██║██║░░░██║░░░██║░░░██║░░██║░░░██║░░░██╔══██╗██╔══██║██║░░██║██╔══╝░░██╔══██╗
██║░░██║╚██████╔╝░░░██║░░░╚█████╔╝░░░██║░░░██║░░██║██║░░██║██████╔╝███████╗██║░░██║
╚═╝░░╚═╝░╚═════╝░░░░╚═╝░░░░╚════╝░░░░╚═╝░░░╚═╝░░╚═╝╚═╝░░╚═╝╚═════╝░╚══════╝╚═╝░░╚═╝
Server started on port 8009.
Monitoring with 30 second updates.
Connecting to ccxt:binanceusdm (paper environment)...
  Done.
Note that you can also launch the monitor without a config file, by providing some additional information directly. See the docs for the command line interface for more information.
Papertrade Monitoring#
When papertrading, the broker instances used can be pickled, to save their state at that time. This allows us to glance into the simulated trading evironment and query the broker.