AutoTrader Custom Indicators#
This page showcases the indicators available in AutoTraders’ indicator library. All images shown here were created with
AutoPlot, using the view_indicators function. This function can be called using the code snipped provided
below, where indicator_dict is constructed for the indicator being plotted. This dictionary is shown for each indicator
below. Note that the indicators dictionary passed to the view_indicators method must
be formatted according to the correct specification.
from autotrader import indicators
from autotrader.autoplot import AutoPlot

indicator_dict = {}

ap = autoplot.AutoPlot()
ap.data = data
ap.view_indicators(indicator_dict)
For each indicator below, the function definition is provided, along with a sample code snippet of how to plot the indicator with AutoPlot.
Indicators#
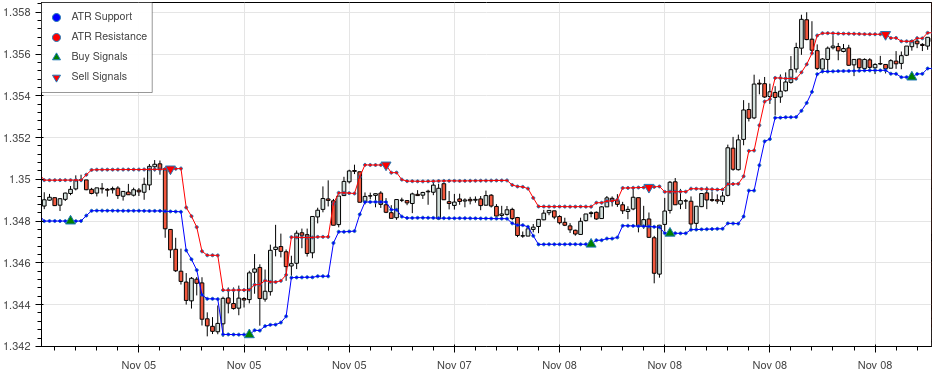
Supertrend Indicator#
- autotrader.indicators.supertrend(data: DataFrame, period: int = 10, ATR_multiplier: float = 3.0, source: Series | None = None) DataFrame#
SuperTrend indicator, ported from the SuperTrend indicator by KivancOzbilgic on TradingView.
- Parameters:
data (pd.DataFrame) – The OHLC data.
period (int, optional) – The lookback period. The default is 10.
ATR_multiplier (int, optional) – The ATR multiplier. The default is 3.0.
source (pd.Series, optional) – The source series to use in calculations. If None, hl/2 will be used. The default is None.
- Returns:
supertrend_df – A Pandas DataFrame of containing the SuperTrend indicator, with columns of ‘uptrend’ and ‘downtrend’ containing uptrend/downtrend support/resistance levels, and ‘trend’, containing -1/1 to indicate the current implied trend.
- Return type:
pd.DataFrame
References
st_df = indicators.supertrend(data, ATR_multiplier=2)

indicator_dict = {'Supertrend': {'type': 'Supertrend',
                                  'data': st_df}
                  }
Note that the supertrend dataframe also contains a trend column, indicating the current trend.
Column |
Description |
|---|---|
uptrend |
Uptrend price support level |
downtrend |
Downtrend price support level |
trend |
Current trend (1 for uptrend, -1 for downtrend) |
HalfTrend Indicator#
The HalfTrend indicator is based on the indicator by everget on TradingView.
- autotrader.indicators.halftrend(data: DataFrame, amplitude: int = 2, channel_deviation: float = 2) DataFrame#
HalfTrend indicator, ported from the HalfTrend indicator by Alex Orekhov (everget) on TradingView.
- Parameters:
data (pd.DataFrame) – OHLC price data.
amplitude (int, optional) – The lookback window. The default is 2.
channel_deviation (float, optional) – The ATR channel deviation factor. The default is 2.
- Returns:
htdf – DESCRIPTION.
- Return type:
TYPE
References
halftrend_df = indicators.halftrend(data)
indicator_dict = {'HalfTrend': {'type': 'HalfTrend',
                                'data': halftrend_df}}
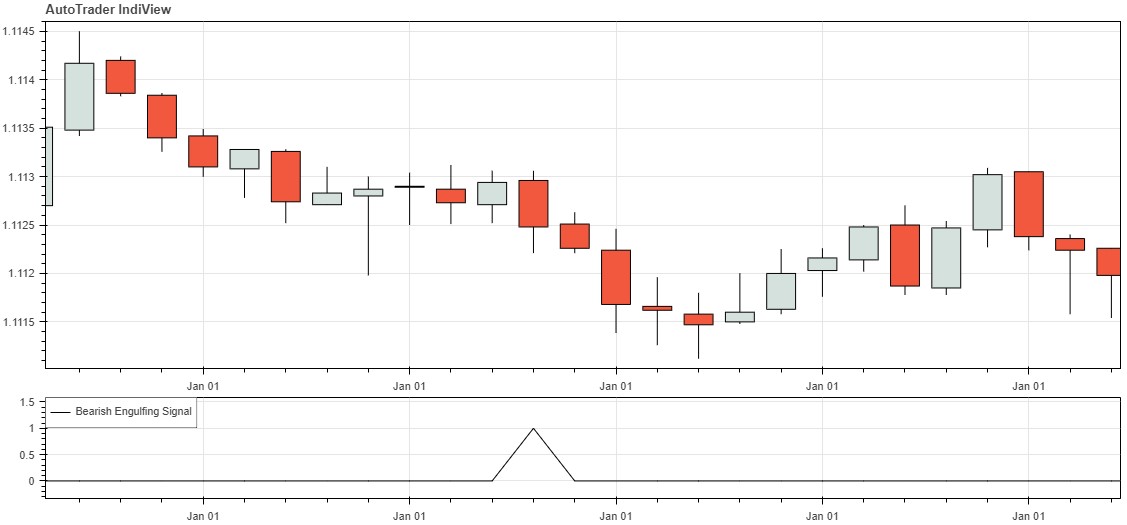
Bearish Engulfing Pattern#
Returns a list with values of 1 when the bearish engulfing pattern appears and a value of 0 elsewhere.
- autotrader.indicators.bearish_engulfing(data: DataFrame, detection: str | None = None)#
Bearish engulfing pattern detection.
engulfing_bearish = indicators.bearish_engulfing(data, detection = None)
indicator_dict = {'Bearish Engulfing Signal': {'type': 'Engulfing',
                                      'data': engulfing_bearish}
                  }
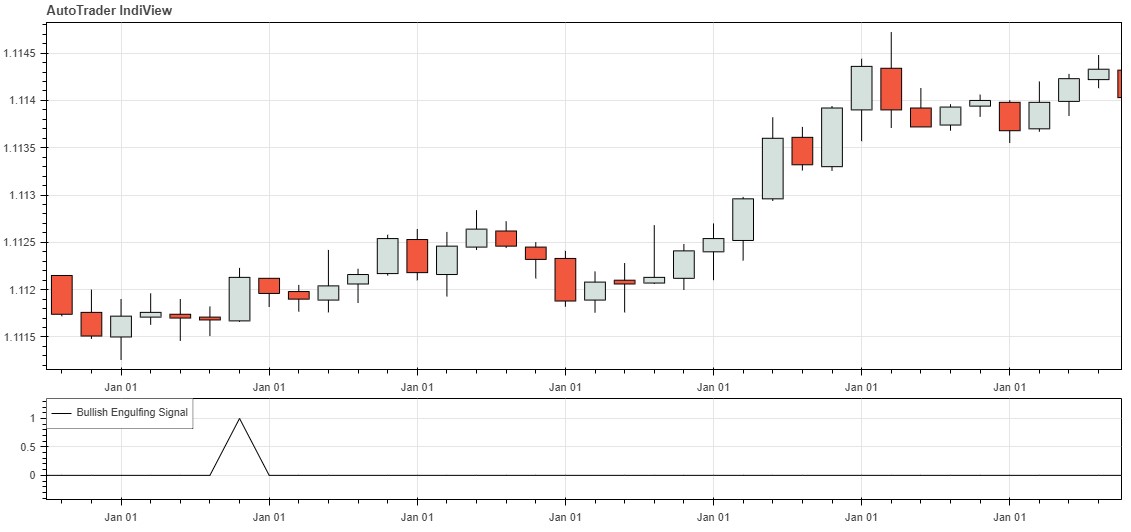
Bullish Engulfing Pattern#
Returns a list with values of 1 when the bullish engulfing pattern appears and a value of 0 elsewhere.
- autotrader.indicators.bullish_engulfing(data: DataFrame, detection: str | None = None)#
Bullish engulfing pattern detection.
engulfing_bullish = indicators.bullish_engulfing(data, detection = None)
indicator_dict = {'Bullish Engulfing Signal': {'type': 'Engulfing',
                                      'data': engulfing_bullish}
                  }
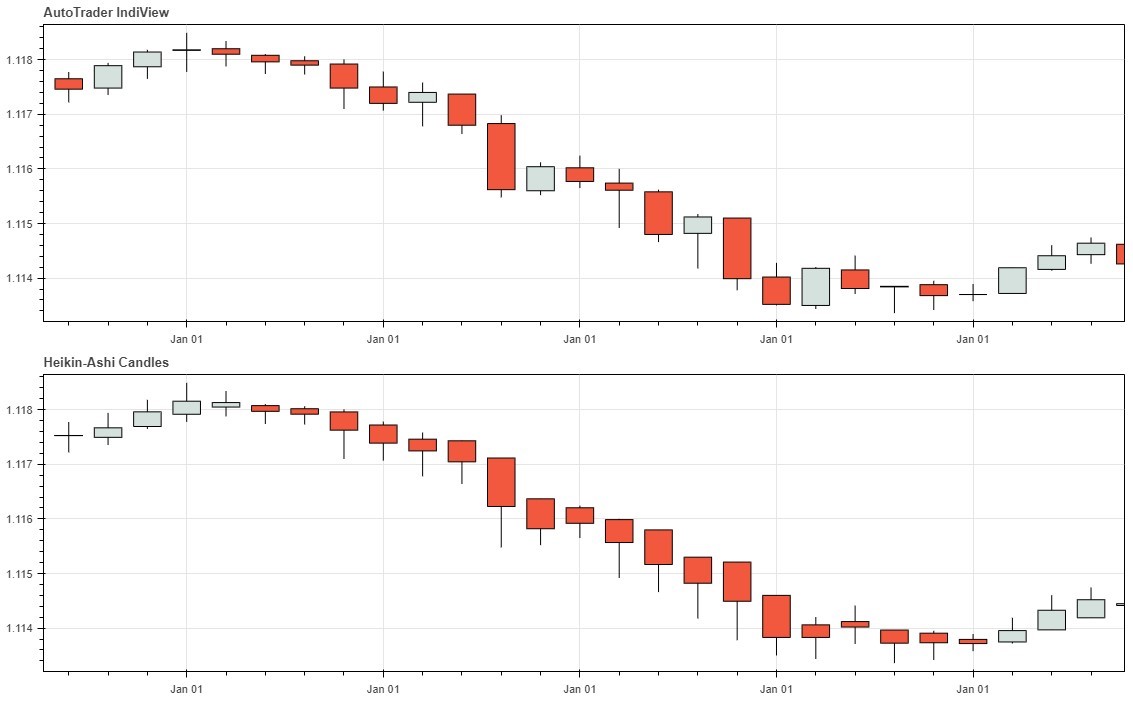
Heikin-Ashi Candlesticks#
Returns a dataframe of Heikin-Ashi candlesticks.
- autotrader.indicators.heikin_ashi(data: DataFrame)#
Calculates the Heikin-Ashi candlesticks from Japanese candlestick data.
ha_data = indicators.heikin_ashi(OHLC_data)

indicator_dict = {'Heikin-Ashi Candles': {'type': 'Heikin-Ashi',
                                          'data': ha_data}
                  }
Note that a copy of the data must be passed into the heikin-ashi function by using the .copy() function, to prevent
overwriting the original data. See here
for more information.
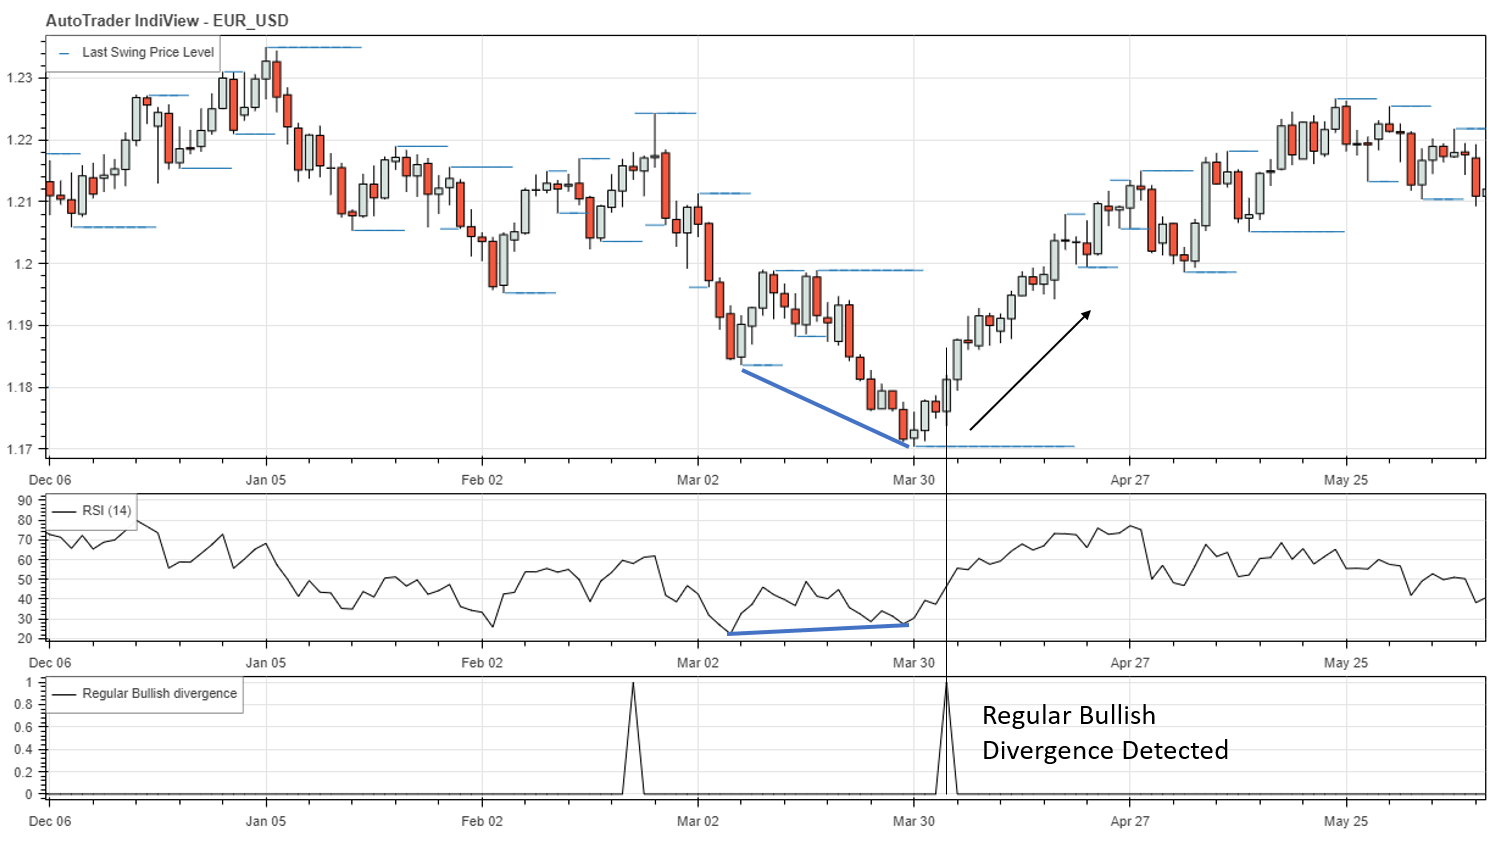
Divergence#
The autodetect_divergence indicator can be used to detect divergence between price movements and and an indicator.
- autotrader.indicators.autodetect_divergence(ohlc: DataFrame, indicator_data: DataFrame, tolerance: int = 1, method: int = 0) DataFrame#
A wrapper method to automatically detect divergence from inputted OHLC price data and indicator data.
- Parameters:
ohlc (pd.DataFrame) – A dataframe of OHLC price data.
indicator_data (pd.DataFrame) – dataframe of indicator data.
tolerance (int, optional) – A parameter to control the lookback when detecting divergence. The default is 1.
method (int, optional) – The divergence detection method. Set to 0 to use both price and indicator swings to detect divergence. Set to 1 to use only indicator swings to detect divergence. The default is 0.
- Returns:
divergence – A DataFrame containing columns ‘regularBull’, ‘regularBear’, ‘hiddenBull’ and ‘hiddenBear’.
- Return type:
pd.DataFrame
rsi_divergence = indicators.autodetect_divergence(data, rsi)

indicator_dict = {'RSI (14)': {'type': 'RSI',
                               'data': rsi},
                  'Bullish divergence': {'type': 'below',
                                         'data': rsi_divergence['regularBull']},
                  }
Below is an example of this indicator, as detailed in the Detecting Divergence blog post. Note that this indicator is actually a wrapper for other indicators, to make detecting divergence even simpler.
See Also
Utility Indicators#
The following is a collection of utility indicators which assist in building effective strategies.
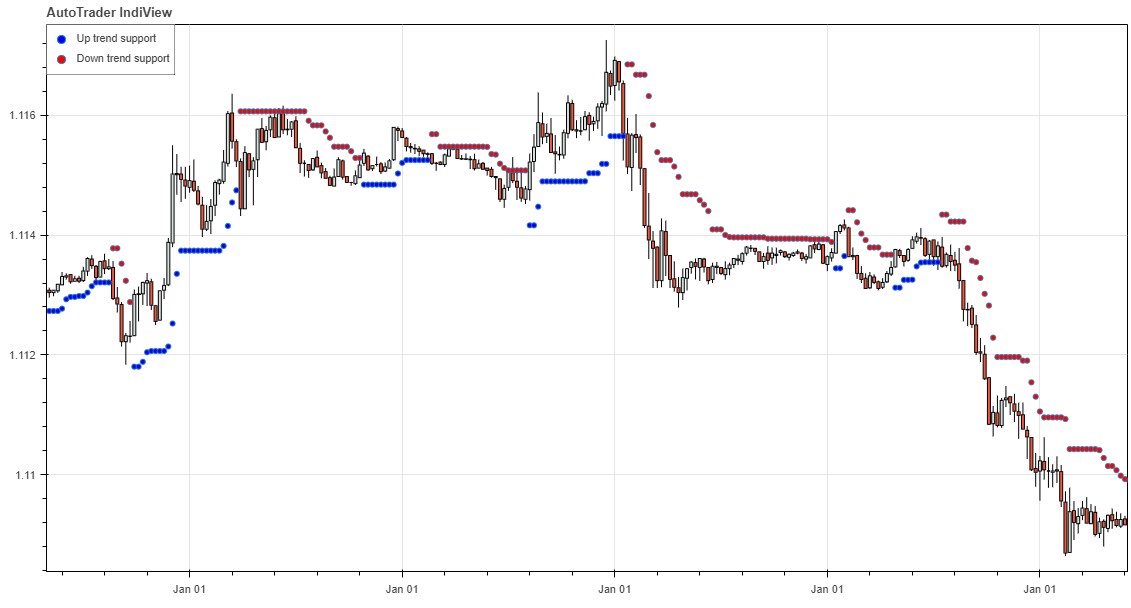
Swing Detection#
A common challenge of algo-trading is the ability to accurately pick recent swings in price to use as stop loss levels. This indicator attempts to solve that problem by locating the recent swings in price. This indicator returns a dataframe with three columns: Highs, Lows and Last, described below.
- autotrader.indicators.find_swings(data: DataFrame, n: int = 2) DataFrame#
Locates swings in the inputted data using a moving average gradient method.
- Parameters:
data (pd.DataFrame | pd.Series | list | np.array) – An OHLC dataframe of price, or an array/list/Series of data from an indicator (eg. RSI).
n (int, optional) – The moving average period. The default is 2.
- Returns:
swing_df (pd.DataFrame) – A dataframe containing the swing levels detected.
pd.Series(hl2, name=”hl2”),
Column |
Description |
|---|---|
Highs |
Most recent swing high |
Lows |
Most recent swing low |
Last |
Most recent swing |
swings         = indicators.find_swings(data)
indicator_dict = {'Swing Detection': {'type': 'Swings',
                                      'data': swings}
                  }
To detect swings, an exponential moving average is fitted to the inputted data. The slope of this line is then used
determine when a swing has been formed. Naturally, this is a lagging indicator. The lag can be controlled by the
input parameter n, which corresponds to the period of the EMA.
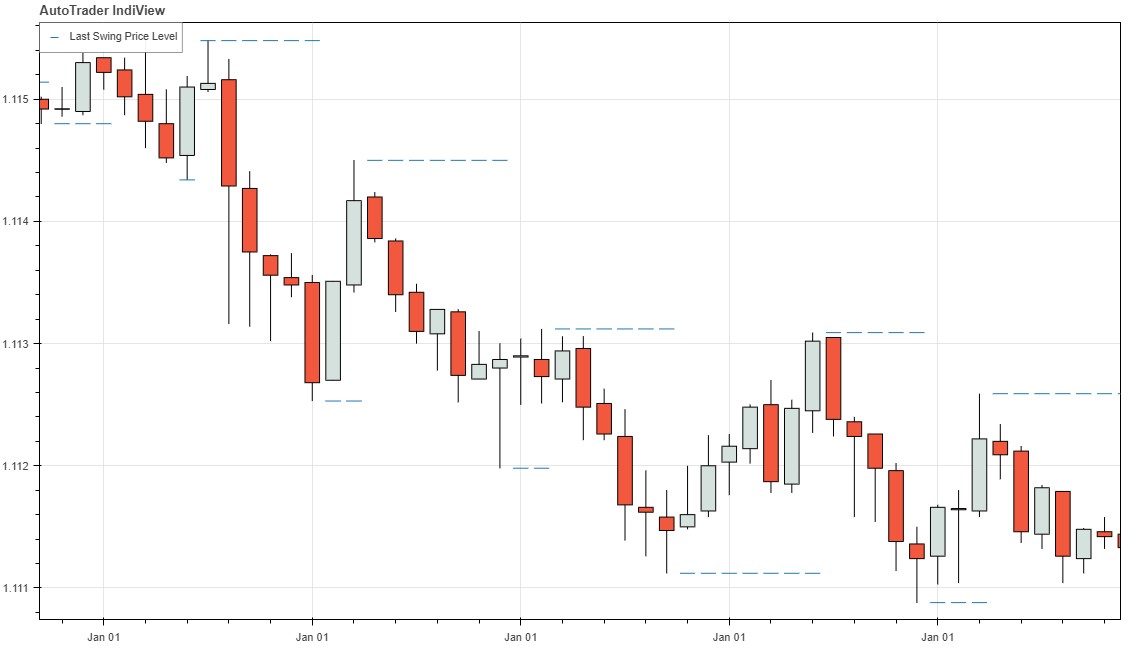
This indicator was used in the MACD strategy developed in the tutorials to set stop-losses.
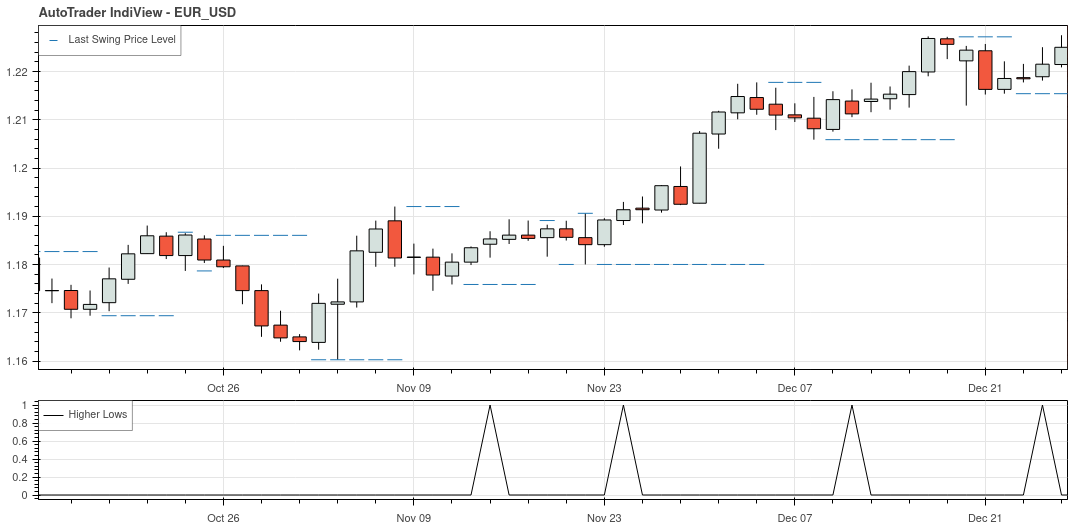
Classifying Swings#
The classify_swings indicator may be used to detect ‘higher highs’ and ‘lower lows’. This indicator of course
also detects ‘lower highs’ and ‘higher lows’. It relies upon the output of the find_swings indicator.
It returns a dataframe with the following columns appended to the swing dataframe.
Column Name |
Description |
Values |
|---|---|---|
|
Higher High |
|
|
Higher Low |
|
|
Lower Low |
|
|
Lower High |
|
- autotrader.indicators.classify_swings(swing_df: DataFrame, tol: int = 0) DataFrame#
Classifies a dataframe of swings (from find_swings) into higher-highs, lower-highs, higher-lows and lower-lows.
- Parameters:
swing_df (pd.DataFrame) – The dataframe returned by find_swings.
tol (int, optional) – The classification tolerance. The default is 0.
- Returns:
swing_df – A dataframe containing the classified swings.
- Return type:
pd.DataFrame
price_swings = indicators.find_swings(price_data)
price_swings_classified = indicators.classify_swings(price_swings)

indicator_dict = {'Price Swings': {'type': 'Swings',
                                   'data': price_swings},
                  'Higher Lows': {'type': 'below',
                                  'data': price_swings_classified['HL']},
                  }
The plot below gives an example of this indicator detecting higher lows in price.
See Also
Detecting Divergence#
To detect divergence between price and an indicator, the detect_divergence indicator may be used. This indicator
relies on both find_swings and classify_swings. It detects regular and hidden divergence.
- autotrader.indicators.detect_divergence(classified_price_swings: DataFrame, classified_indicator_swings: DataFrame, tol: int = 2, method: int = 0) DataFrame#
Detects divergence between price swings and swings in an indicator.
- Parameters:
classified_price_swings (pd.DataFrame) – The output from classify_swings using OHLC data.
classified_indicator_swings (pd.DataFrame) – The output from classify_swings using indicator data.
tol (int, optional) – The number of candles which conditions must be met within. The default is 2.
method (int, optional) – The method to use when detecting divergence (0 or 1). The default is 0.
- Raises:
Exception – When an unrecognised method of divergence detection is requested.
- Returns:
divergence – A dataframe containing divergence signals.
- Return type:
pd.DataFrame
Notes
- Options for the method include:
0: use both price and indicator swings to detect divergence (default)
1: use only indicator swings to detect divergence (more responsive)
The example below shows the indicator detecting regular bullish divergence in price using the RSI as the indicator.
See Also
Crossover#
Returns a list with values of 1 when input list_1 crosses above input list_2, values of -1 when input
list_1 crosses below input list_2, and values of 0 elsewhere.
- autotrader.indicators.crossover(ts1: Series, ts2: Series) Series#
Locates where two timeseries crossover each other, returning 1 when list_1 crosses above list_2, and -1 for when list_1 crosses below list_2.
- Parameters:
ts1 (pd.Series) – The first timeseries.
ts2 (pd.Series) – The second timeseries.
- Returns:
crossovers – The crossover series.
- Return type:
pd.Series
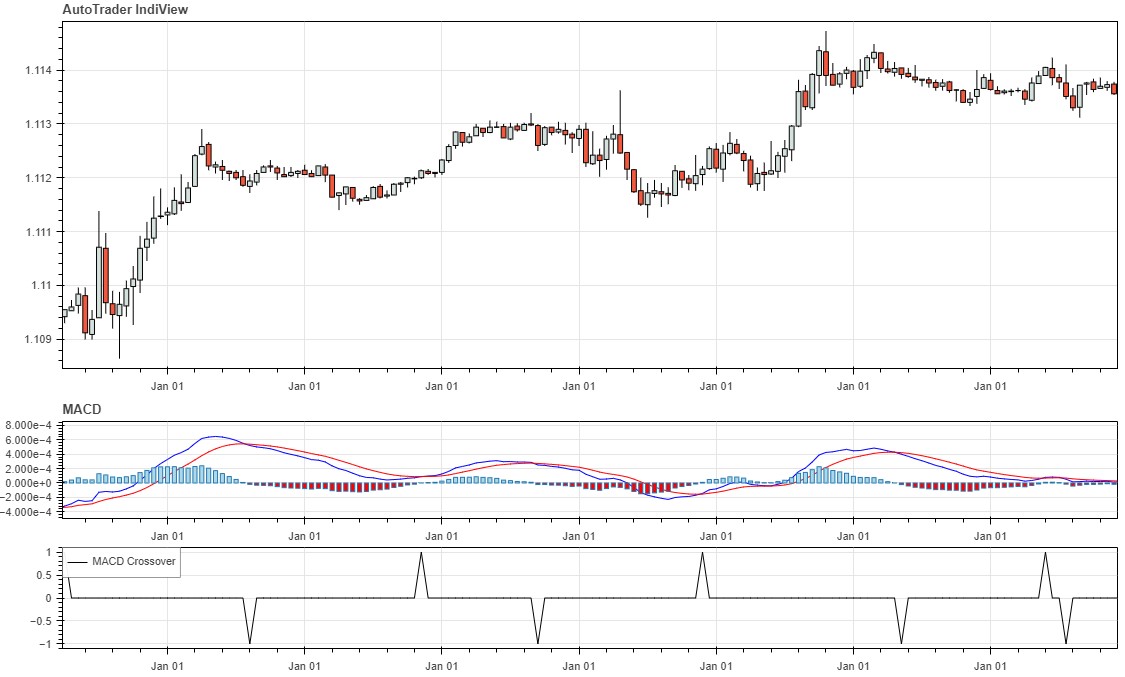
The example below illustrates the functionality of this indicator with the
MACD indicator. Note that the MACD line is passed into
indicators.crossover as list_1, and the MACD signal line as list_2. This ensures that a value of 1 will
correspond to points when the MACD line crosses above the signal line, and a value of -1 when it crosses
below the signal line.
macd, macd_signal, macd_hist = ta.MACD(data.Close.values)
macd_crossover = indicators.crossover(macd, macd_signal)

indicator_dict = {'MACD': {'type': 'MACD',
                           'macd': macd,
                           'signal': macd_signal,
                           'histogram': macd_hist},
                  'MACD Crossover': {'type': 'Crossover',
                                     'data': macd_crossover}
                  }
Cross Value#
Returns the value at which a crossover occurs using linear interpolation. Requires three inputs: two lists and a third list corresponding to the points in time which the two lists crossover. Consider the example described below.
- autotrader.indicators.cross_values(ts1: list | Series, ts2: list | Series, ts_crossover: list | Series | None = None) list | Series#
Returns the approximate value of the point where the two series cross.
- Parameters:
ts1 (list | pd.Series) – The first timeseries..
ts2 (list | pd.Series) – The second timeseries..
ts_crossover (list | pd.Series, optional) – The crossovers between timeseries 1 and timeseries 2.
- Returns:
cross_points – The values at which crossovers occur.
- Return type:
list | pd.Series
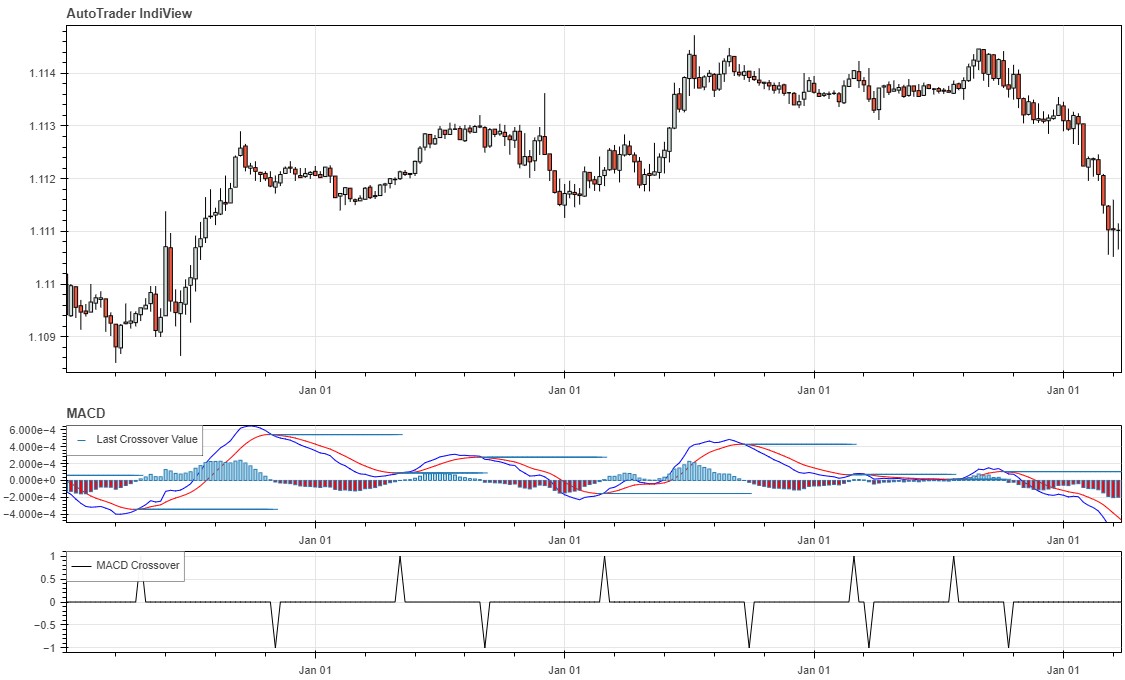
The example provided below builds upon the example described for the crossover indicator. Again, the MACD
indicator is used, and MACD/signal line crossovers are found using indicators.crossover. The specific values at which
this crossover occurs can then be calculated using indicators.cross_values(macd, macd_signal, macd_crossover). This will
return a list containing the values (in MACD y-axis units) where the crossover occured. This is shown in the image below,
labelled ‘Last Crossover Value’. This indicator is useful in strategies where a crossover must occur above or below a
specified threshold.
macd, macd_signal, macd_hist = ta.MACD(data.Close.values)
macd_crossover = indicators.crossover(macd, macd_signal)
macd_covals = indicators.cross_values(macd, macd_signal, macd_crossover)

indicator_dict = {'MACD': {'type': 'MACD',
                           'macd': macd,
                           'signal': macd_signal,
                           'histogram': macd_hist,
                           'crossvals': macd_covals},
                  'MACD Crossover': {'type': 'Crossover',
                                     'data': macd_crossover}
                  }
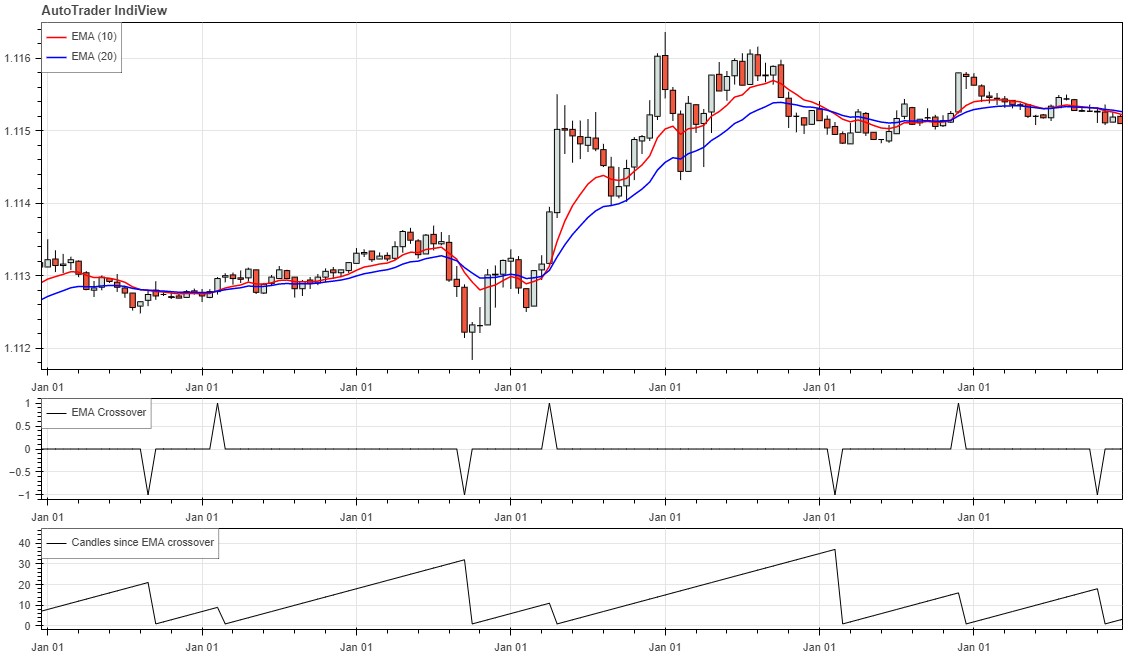
Candles Between Crosses#
Returns a list with a count of how many candles have passed since the last crossover (that is, how many elements in a list since the last non-zero value).
- autotrader.indicators.candles_between_crosses(crosses: list | Series, initial_count: int = 0) list | Series#
Returns a rolling sum of candles since the last cross/signal occurred.
- Parameters:
crosses (list | pd.Series) – The list or Series containing crossover signals.
- Returns:
counts – The rolling count of bars since the last crossover signal.
- Return type:
TYPE
See also
indicators.crossover
The example provided below demonstrates this indicator with EMA crossovers.
ema10           = ta.EMA(data.Close.values, 10)
ema20           = ta.EMA(data.Close.values, 20)
ema_crossovers  = indicators.crossover(ema10, ema20)
ema_crosscount = indicators.candles_between_crosses(ema_crossovers)

indicator_dict = {'EMA (10)': {'type': 'MA',
                               'data': ema10},
                  'EMA (20)': {'type': 'MA',
                               'data': ema20},
                  'EMA Crossover': {'type': 'Crossover',
                                     'data': ema_crossovers},
                  'Candles since EMA crossover': {'type': 'Crosscount',
                                                  'data': ema_crosscount}
                  }
Heikin-Ashi Candlestick Run#
- autotrader.indicators.ha_candle_run(ha_data: DataFrame)#
Returns a list for the number of consecutive green and red Heikin-Ashi candles.
- Parameters:
ha_data (pd.DataFrame) – The Heikin Ashi OHLC data.
See also
This indicator returns two lists; one each for the number of consecutive green and red Heikin-Ashi candles. Since Heikin-Ashi trends usually last for approximately 5-8 candles, it is useful to know how many consecutive red or green candles there have been so far, to avoid getting into a trend too late. This indicator allows you to prevent that by telling you how many candles into a trend the price action is.
Merge signals#
Returns a single signal list which has merged two signal lists.
- autotrader.indicators.merge_signals(signal_1: list, signal_2: list) list#
Returns a single signal list which has merged two signal lists.
- Parameters:
signal_1 (list) – The first signal list.
signal_2 (list) – The second signal list.
- Returns:
merged_signal_list – The merged result of the two inputted signal series.
- Return type:
list
Examples
>>> s1 = [1,0,0,0,1,0]
>>> s2 = [0,0,-1,0,0,-1]
>>> merge_signals(s1, s2)
    [1, 0, -1, 0, 1, -1]
Rolling Signal#
Returns a list which maintains the previous signal, until a new signal is given.
- autotrader.indicators.rolling_signal_list(signals: list | Series) list#
Returns a list which repeats the previous signal, until a new signal is given.
- Parameters:
signals (list | pd.Series) – A series of signals. Zero values are treated as ‘no signal’.
- Returns:
A list of rolled signals.
- Return type:
list
Examples
>>> rolling_signal_list([0,1,0,0,0,-1,0,0,1,0,0])
    [0, 1, 1, 1, 1, -1, -1, -1, 1, 1, 1]
Unroll Signal List#
Performs the reverse function of rolling.
- autotrader.indicators.unroll_signal_list(signals: list | Series) array#
Unrolls a rolled signal list.
- Parameters:
signals (Union[list, pd.Series]) – DESCRIPTION.
- Returns:
unrolled_signals – The unrolled signal series.
- Return type:
np.array
See also
ThisExamples
>>> unroll_signal_list([0, 1, 1, 1, 1, -1, -1, -1, 1, 1, 1])
    array([ 0.,  1.,  0.,  0.,  0., -1.,  0.,  0.,  1.,  0.,  0.])